





Why Traffic Deaths Matter
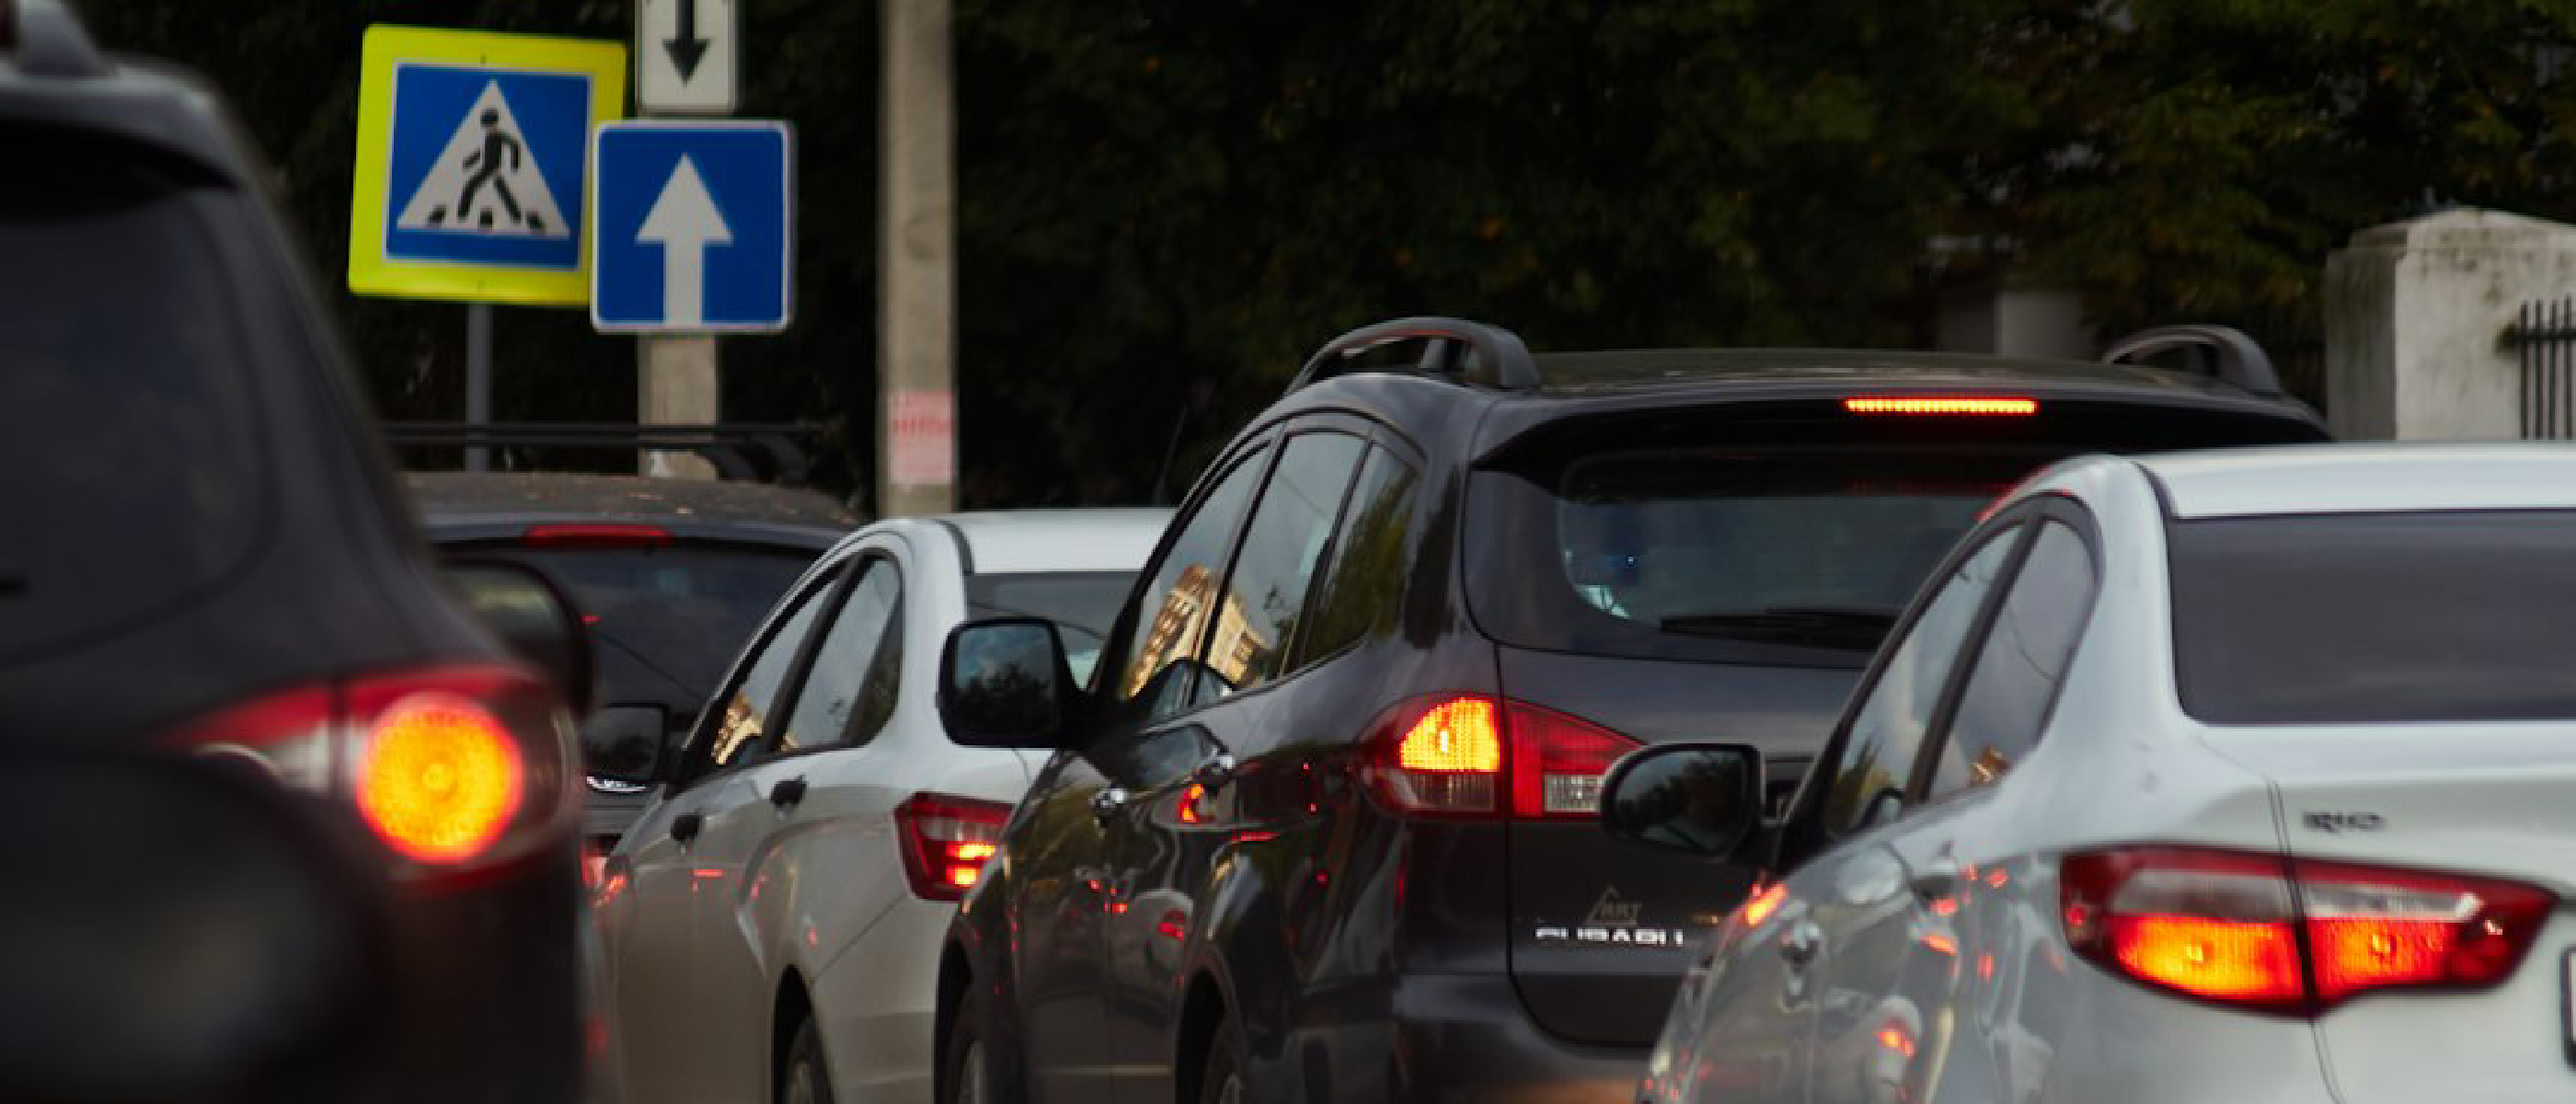
Every year, more than one million people die in traffic crashes worldwide, with the United States alone losing 100 lives daily. These fatalities disproportionately affect children and young adults, making road safety a public health crisis. While the overall death rate has declined since the 1930s, recent data show a troubling uptick in pedestrian incidents across the U.S. The paradox is clear: traffic deaths are largely preventable, yet they are often treated as an inevitable part of modern life. Understanding the scale of the problem is the first step toward meaningful change.
Vision Zero: A Global Framework
Vision Zero, a concept first adopted in Sweden in the 1990s, aims to eliminate traffic fatalities by treating every road user as a human being rather than a commodity. The Vision Zero Network, founded by Leah Shahum, coordinates efforts across cities and countries, providing a shared playbook of evidence‑based interventions. Key principles include:
- Human‑centered design: Roads are engineered to accommodate pedestrians, cyclists, and drivers safely.
- Speed management: Lowering vehicle speeds reduces both the likelihood and severity of crashes.
- Data‑driven decision making: Crash hotspots are identified through analytics, guiding targeted interventions.
The network’s influence has spread to cities like Hoboken, New Jersey, and Edmonton, Alberta, where tailored strategies have produced measurable reductions in fatalities and serious injuries.
Technical Breakdown of Traffic‑Calming Measures
Traffic‑calming is the cornerstone of Vision Zero’s approach. The measures are simple yet powerful, often requiring minimal infrastructure investment while delivering high safety returns.
1. Intersection Tightening with Planters
Planters—potted plants or landscaped boxes—are strategically placed at intersection corners to narrow the roadway. This physical constraint forces drivers to reduce speed before entering the intersection, lowering the risk of high‑speed collisions. In Hoboken, the use of planters has been paired with curb extensions to create a more pedestrian‑friendly environment.
2. Speed Limit Adjustments
Lowering speed limits is a universally effective strategy. In Edmonton, a citywide reduction from 50 mph to 35 mph on key corridors led to a 63 % drop in fatalities between 2015 and 2020. Speed limit changes are often accompanied by speed cameras and increased enforcement to ensure compliance.
3. Curb Extensions and Pedestrian Islands
Extending curbs into the roadway shortens the crossing distance for pedestrians, reducing exposure time. In Hoboken, curbs have been extended by 10 ft in high‑traffic zones, creating “pedestrian islands” that serve as safe waiting areas. These extensions also slow vehicles as they negotiate the narrowed lane.
4. Intelligent Signal Timing
Adjusting traffic signal cycles to prioritize pedestrian phases can dramatically improve safety. Edmonton’s signal redesigns have increased pedestrian phase time by 30 %, allowing more vehicles to clear the intersection before pedestrians cross.
5. Surveillance and Data Analytics
High‑definition cameras installed at critical intersections capture real‑time traffic patterns. Data from these cameras feed into GIS platforms that identify crash‑prone spots. Hoboken’s use of camera data has guided the redesign of three intersections that accounted for 40 % of all crashes in the city.
Case Studies: Hoboken and Edmonton
Hoboken, New Jersey
Hoboken’s Vision Zero implementation is a textbook example of how local policy can drive safety. Since 2017, the city has recorded no traffic fatalities—a milestone achieved through a combination of speed limit reductions, curb extensions, and public transit investment. The city’s approach also includes:
Public transit subsidies: Encouraging commuters to use buses and trains reduces vehicle
Public transit subsidies: Encouraging commuters to use buses and trains reduces vehicle miles traveled, eases congestion, and creates a safer environment for pedestrians and cyclists. The city has allocated $2 million annually to keep fares below the regional average, resulting in a 12 % increase in ridership since 2019.
Parking reallocation: By converting under‑utilized curbside parking into widened sidewalks and bike lanes, Hoboken has reclaimed 1.8 miles of roadway for active travel. Although the proposal initially faced pushback from local businesses, a pilot program demonstrated a 7 % boost in foot traffic for storefronts adjacent to the new lanes.
Community‑driven design workshops: Residents are invited to “street labs” where they can test mock‑ups of planters, curb extensions, and signage. This participatory approach has helped the city prioritize interventions that reflect neighborhood needs and cultural contexts.
Edmonton, Alberta
Edmonton’s Vision Zero journey began in 2015 with a city‑wide audit of crash data. The findings revealed that a disproportionate number of serious injuries occurred at mid‑block crossings lacking adequate signalization. The city’s response combined engineering, enforcement, and education (the classic “3 E” model):
Dynamic Speed‑Reduction Zones: Using variable‑message signs, speed limits automatically drop to 30 km/h during peak pedestrian periods (7 am–9 am and 4 pm–6 pm).
Mid‑Block Pedestrian Refuge Islands: Over 150 islands have been installed, each equipped with high‑visibility markings and flashing beacons.
Smart Signal Controllers: These devices adjust the length of pedestrian phases based on real‑time demand, cutting average wait times by 22 %.
Targeted Enforcement Campaigns: Speed cameras paired with a “Vision Zero” branding campaign have issued over 4,800 citations in the first two years, reinforcing the message that speeding is unacceptable.
School‑Zone Safety Programs: Partnerships with local schools have introduced “walk‑to‑school” ambassadors who monitor traffic and educate peers about safe crossing practices.
The cumulative effect of these measures was a 63 % reduction in traffic fatalities and a 40 % decline in serious injuries between 2015 and 2020, surpassing the city’s original targets by a wide margin.
Challenges and Lessons Learned
While both cities showcase impressive outcomes, their experiences also highlight common obstacles that other municipalities should anticipate:
| Challenge | Hoboken Example | Edmonton Example | Mitigation Strategies |
|---|---|---|---|
| Political resistance | Opposition to parking removal from local merchants | Concerns over budget reallocations for smart infrastructure | Conduct cost‑benefit analyses and pilot projects to demonstrate economic upside |
| Funding gaps | Limited state grant eligibility for small‑scale interventions | High upfront costs for intelligent signal systems | Leverage public‑private partnerships and apply for Vision Zero grant programs |
| Data silos | Separate traffic, transit, and public health datasets | Inconsistent crash reporting across jurisdictions | Adopt an integrated GIS platform that consolidates all relevant data streams |
| Public perception | “Speed limits are too low; they hurt drivers” | Misunderstanding of “dynamic” speed zones as punitive | Run continuous education campaigns featuring local testimonials and transparent metrics |
A recurring theme is the importance of iterative implementation: start with low‑cost, high‑impact measures (e.g., planters, curb extensions), evaluate outcomes, and then scale up to more complex solutions like adaptive signal control.
The Road Ahead: Scaling Vision Zero
The success stories of Hoboken and Edmonton are fueling a broader movement. As of 2025, more than 150 cities worldwide have formally adopted Vision Zero targets, and the Vision Zero Network reports a 12 % annual increase in member municipalities. Emerging technologies—connected vehicle data, AI‑driven crash prediction, and micro‑mobility integration—promise to accelerate progress. However, the core philosophy remains unchanged: design streets for people, not just for cars.
Policymakers can accelerate adoption by:
- Embedding Vision Zero into municipal planning statutes to ensure long‑term commitment beyond election cycles.
- Standardizing performance metrics (e.g., fatalities per 100,000 residents, serious injury rates) to enable cross‑city benchmarking.
- Allocating dedicated budget lines for traffic‑calming infrastructure, rather than treating them as ad‑hoc projects.
- Fostering community ownership through transparent dashboards that display real‑time safety data and progress toward targets.
When these elements align, the vision of streets where no one is killed or seriously injured becomes not just aspirational, but achievable.
Conclusion
Traffic deaths are not an immutable fact of modern life; they are a solvable public‑health problem. Hoboken’s zero‑fatality streak since 2017 and Edmonton’s dramatic 63 % fatality reduction illustrate that a mix of human‑centered design, data‑driven interventions, and sustained political will can turn the tide. By learning from these case studies, embracing iterative, community‑focused solutions, and leveraging emerging technologies, cities of any size can move closer to the ultimate goal of Vision Zero: streets that protect every road user.
Frequently Asked Questions
Q1: Does Vision Zero mean eliminating all traffic?
No. Vision Zero seeks to eliminate fatalities and serious injuries, not all vehicle traffic. It encourages a balanced transportation ecosystem where cars, bikes, pedestrians, and transit coexist safely.
Q2: How quickly can a city expect to see results?
Early wins often appear within 12–24 months after implementing low‑cost measures such as planters or curb extensions. More complex interventions (e.g., adaptive signal systems) may take 2–3 years to show measurable impact.
Q3: What is the typical cost of a traffic‑calming project?
Costs vary widely. Simple planters can be installed for under $5,000 per intersection, while a full smart‑signal upgrade may run $150,000–$250,000. Funding can be sourced from municipal budgets, state/federal safety grants, and private partnerships.
Q4: How can residents get involved?
Participate in local “street labs,” attend city council meetings on transportation, volunteer as a “walk‑to‑school” ambassador, or submit feedback through municipal open‑data portals that track Vision Zero progress.
Q5: Are there any proven “quick wins” for cities with limited budgets?
Yes. Installing planters, repainting lane markings to indicate reduced speeds, adding high‑visibility crosswalks, and deploying temporary curb extensions using paint or modular barriers are all cost‑effective strategies that yield immediate safety benefits.
Q6: What role does technology play in Vision Zero?
Advanced analytics, AI‑powered crash prediction, connected‑vehicle data, and real‑time signal optimization enhance the precision of interventions, allowing cities to allocate resources where they will have the greatest impact.
Q7: How does Vision Zero address equity concerns?
Equitable implementation ensures that historically underserved neighborhoods receive the same level of safety improvements. Data‑driven targeting helps identify high‑risk areas that often overlap with low‑income communities, directing resources where they are needed most.
Source: Original Article